
Frami IndoorMap
The original plan was to create an AR and mobile guide pilot for hospitals and primary care services in Finland to help patients move more efficiently within and between healthcare facilities. But during the first part of the project Finland’s provinces were immersed in a national social and health care reform implemented at the regional level, and it was not possible for the interim organisation to give permission to implement the pilot in the district hospital of South Ostrobothnia.
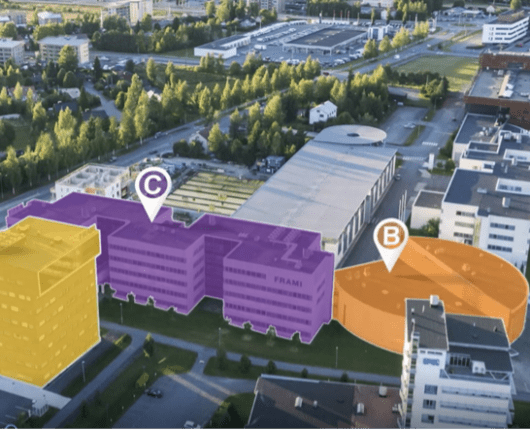
Changing the pilot only affected the location. The technology and type of service remain unchanged. The pilot is now located at the Frami Research and Conference Centre in Seinäjoki, South Ostrobothnia https://www.frami.fi/briefly-in-english/.
The pilot aims to deliver two alternative AR mobile guides, ARway and Tangar Navigator, to the Frami building. The mobile guide will allow customers to navigate within and between the facilities more efficiently. The smart guide will help people moving between different offices and buildings to navigate from the parking lot to the right entrance, find the exact location of the office or the clerk, navigate there and at the same time get easily updated information about Frami’s additional services (meeting rooms, restaurants, art exhibitions, etc.). Chatbots and a 360-degree aerial view were also selected as tools for the pilot.
The pilot is being developed together with stakeholders, such as Into Seinäjoki Oy, the manager of the Fram buildings, and various organisations interested in participating in the pilot and helping their customers with the guide.
The Frami IndoorMap pilot will create a digital service model that can be transferred to different public buildings in the region.
Conclusions
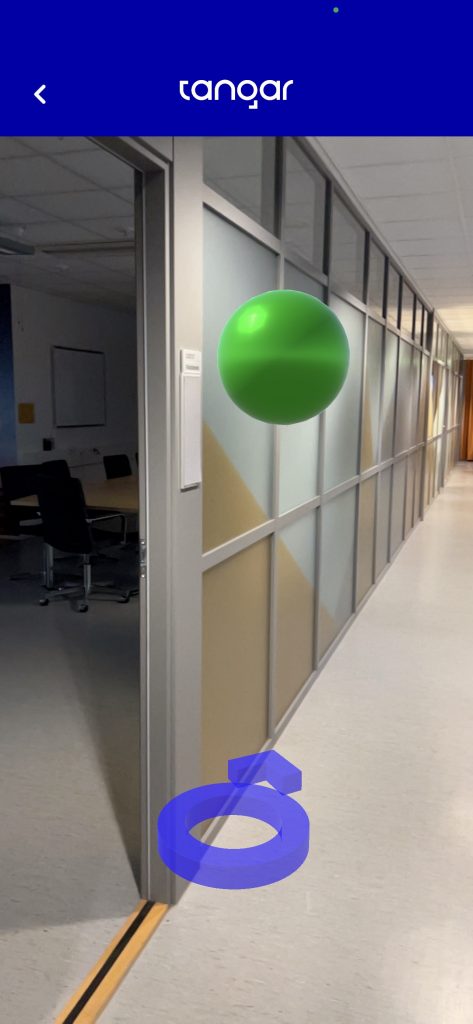
“FRAMI indoor map” was designed to provide an AR mobile guide around the Frami Research and Conference Centre. The goal was to help customers to be more efficient at navigating within and between building’s premises, such as offices, restaurants, corridors, and parking lots. It was parallelly tested on two different technologies, 1) ARway and 2) Tangar.
The tasks were designed to check whether users were able to navigate around the big FRAMI buildings and check how 3D elements are perceived in this type of applications. System usability scale results show that “ARway” tool was not yet ready for mass usage. Several users had problems using the system and users of different operating systems had different experiences. On the other hand, the navigator made with “Tangar” received a “good” score, meaning the respondents found the digital tool convenient for use. Similar were the results from the UEQ testing, where the “ARway” tool performed quite poorly in comparison to the benchmark data set and in comparison, to the results from the “Tangar” tool. The second tool was found as intuitive and easy to use. The respondents suggested improvement regarding stimulation to provide more motivation and excitement for using the app. Overall the product developed using Tangar overperformed ARway and should be the one chosen for further development.
Please contact us for a "low threshold" if you are planning a digital indoor map application.